Overview
Anyone who's ever worked at a job probably feels like they don't get paid fairly. But what is "fair" in the context of pay? It may seem straightforward, but the concept of fairness means different things to different people. For some it's about equality relative to your peers. For others it's about equal opportunities. And for others it's about merit, earning what you put in.
It's no wonder organizations struggle to pay fairly. Even when companies prioritize their employees, the way they divvy up profits may make some feel good while others feel left out. So to help shed some light on this important topic, we ran an experiment testing 3 distribution methods for employee bonus pay and measured how fair workers perceive them to be.
The 3 distribution methods we tested include:
* Egalitarian (equal pay)
* Merit (high pay for high performers)
* Lottery ($ distributed randomly)
Last but not least, we tested whether certain groups of people view these methods' fairness differently:
* People with high vs. low zero-sum (i.e., win-lose) beliefs about society
* Men vs. Women
* Older vs. Younger
* Democrats vs. Republicans
The Experiment
We had 400 people from Amazon MTurk participate in a survey experiment, a vignette scenario of a hypothetical organization distributing extra pay to workers. Participants read the following scenario, with 1 of the 3 pay distribution methods (i.e., equal, merit, or lottery) randomly displayed as a randomized controlled trial:
Imagine that you work for an organization that employs 100 people. At the end of the year, the organization has a fund of $10,000 to distribute to these employees.
The organization has decided to distribute the funds through an [egalitarian system, that is, each employee will receive $100.] / [merit-based system, that is, the top 20% of high performers will receive the most funds, followed by the next highest 20% who will receive less, and so on.] / [lottery system, that is, a random number will decide how many employees to split the funds between and how much each employee receives.]
To what extent do you think this distribution system is fair?
(1 = Not fair at all; 7 = Very fair)
Participants also rated their zero-sum beliefs about society (1-7 scale) and indicated their gender, age, and political party in separate survey questions.
Results
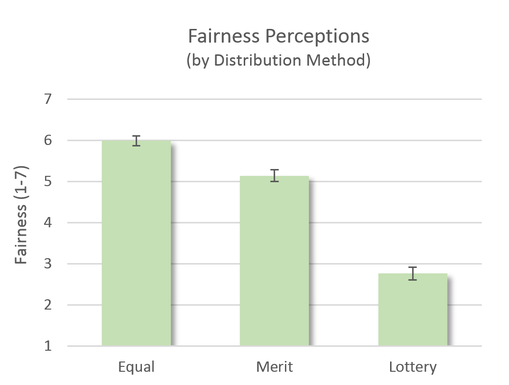
The results were so significant that we triple-checked the data. Overall, very strong differences in fairness emerged between the three different ways of distributing money (F = 143.08; p < 0.001). The lottery method was perceived to be the least fair (average rating = 2.76), much lower than merit-based distribution (average = 5.14; p < 0.001) and equal distribution (average = 5.99; p < 0.001). A pairwise test between equal and merit-based also revealed a significant difference, with equal distribution perceived as quite a bit more fair (difference = 0.85; p < 0.001).
Results
The results were so significant that we triple-checked the data. Overall, very strong differences in fairness emerged between the three different ways of distributing money (F = 143.08; p < 0.001). The lottery method was perceived to be the least fair (average rating = 2.76), much lower than merit-based distribution (average = 5.14; p < 0.001) and equal distribution (average = 5.99; p < 0.001). A pairwise test between equal and merit-based also revealed a significant difference, with equal distribution perceived as quite a bit more fair (difference = 0.85; p < 0.001).
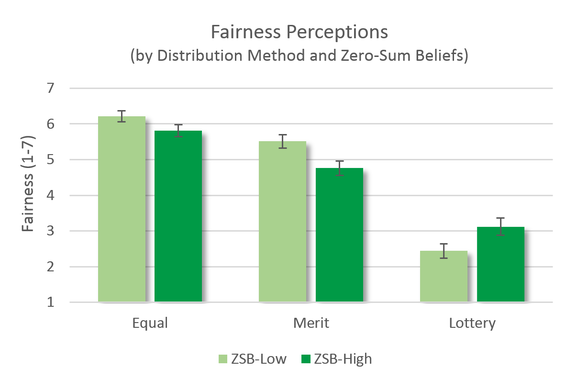
A less significant, but nonetheless interesting, relationship was identified between zero-sum beliefs and the effect of distribution method on fairness (F = 63.07; p < 0.001). Although the order of perceived fairness for each distribution was still the same (equal highest, merit in the middle, and lottery lowest), respondents with high zero-sum beliefs viewed equal and merit-based distributions as less fair and lottery as more fair than respondents with low zero-sum belief. There was no direct relationship between zero-sum beliefs and overall fairness perceptions (p = 0.577).
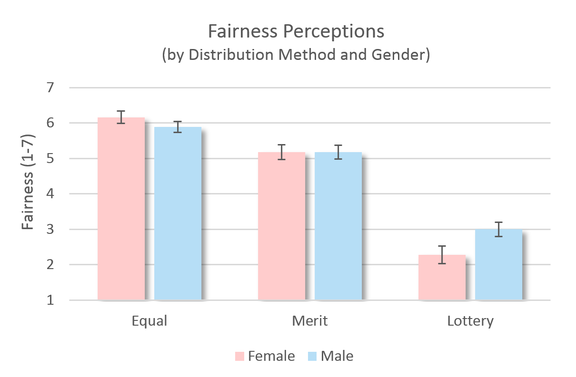
A similar relationship was identified for gender, but the results were not as significant as zero-sum beliefs. Lottery distribution was perceived as slightly more fair by men than women (difference = 0.72; p = 0.029). No interactive relationship was identified with age.
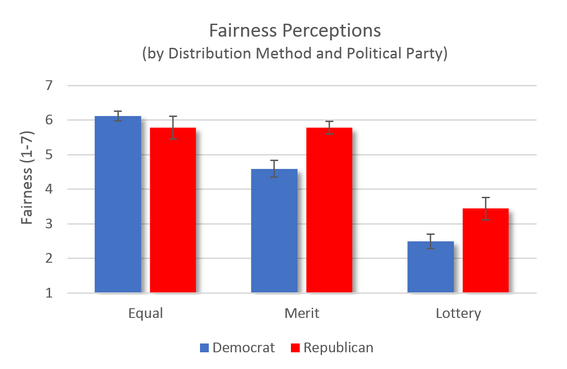
More interesting was the interactive relationship with political beliefs, specifically Republicans and Democrats (F = 48.09, p < 0.0001). Overall, Democrats’ fairness perceptions were lower than those of Republicans (diff. = 0.63; p = 0.015). Although there was surprisingly no significant difference in fairness perceptions between Republicans and Democrats toward equal distribution (p = 0.27), Republicans viewed merit-based distribution as significantly more fair than Democrats (diff. = 1.19; p = 0.001), as was also the case for lottery distribution (diff. = 0.95; p = 0.013). In full disclosure, there were fewer Republicans in our sample than Democrats (about 1:2), and splitting the sample to compute averages by both distribution method and political party yielded smaller sub-samples and wider confidence intervals. But the significance of the differences provides an interesting lead for future research
Conclusion
When it comes to pay, fairness matters. And when it comes to fairness, the method companies use for distributing that pay matters a great deal too. Equal approaches to pay distribution seem to be perceived as more fair than merit-based methods, and much more fair than lotteries, which is interesting considering that lotteries give everyone an equal chance to be selected.
But just as fairness and distribution method matters, so too does the makeup of your employees. The difference between equal and merit-based bonus pay disappeared when we looked only at Republican respondents, whereas this gap widened for Democrats.
So for managers considering how to distribute a portion of their profits to employees, it might not hurt to learn a bit more about your team and consider what they think is fair. The answers may surprise you.
Methods Note
We used ordinary least squares (OLS) regression analyses to test for significant differences in perceived fairness between each of the three distribution methods. For "significant differences," the difference between the groups' averages would be large and its corresponding “p-value” would be small. If the p-value is less than 0.05, we consider the difference statistically significant, meaning we'd likely find a similar effect if we ran the study again with this population. To test whether differences for specific groups differ significantly from their counterparts (e.g., Republicans vs. Democrats) we used OLS regression analyses with interaction terms.
The survey materials and data for this experiment are available on our page on the Open Science Framework.
Popular Experiments
COVID MasksDoes wearing a COVID mask affect how others think of you?
|

Video GamesAre video games more enjoyable than board games?
Does age or gender matter? |

Zero-Sum PoliticsDo Democrats or Republicans view society as win-lose?
|