Overview
Fitness is a great hobby. It can keep you in shape, improve your health, and serve as a mode of transportation. Running and cycling in particular have emerged as fitness hobbies in cities across the globe.
However, cyclists and runners have caught flack recently, as portrayed in pop culture (e.g., memes) for pet peeves like disregarding traffic laws, taking over sidewalks, and crowding out slower-moving pedestrians. But are the jokes actually representative of wider-spread perceptions? We ran a simple vignette experiment to find out.
The Experiment
We recruited 400 people from Amazon Mechanical Turk to read some information about a hypothetical person with one of the facts being that he either walks, runs, or bikes to work every day (randomly assigned). We then asked participants how much they like the person.
Participants were told the following:
Below are a few facts about a person you haven’t met yet.
- Male
- 29 years old
- Enjoys [walking / running / cycling] and [walks / jogs / bikes] to work each day
Participants were then asked “How much do you like this person? (1 = Not at all, 7 = Very much)” using a 1-7 scale. At the end of the survey, we asked participants “Do you exercise at least 3-4 times per week?” (answer options “Yes,” “No,” Not sure”) to test if fellow fitness folks perceive our walker, runner, and cyclist differently than participants who do not regularly exercise.
Results
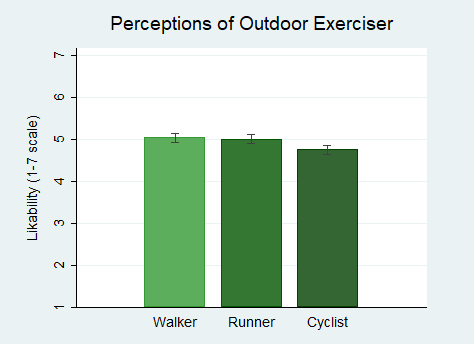
Our analysis, an ordinary least squares regression analysis, revealed that likability ratings were a bit higher for walkers (avg. = 5.05) and runners (avg. = 5.02) than cyclists (avg. = 4.76). Relative to walkers, there was no statistically significant difference for runners (p = 0.796) but there was for cyclists (p = 0.041). This difference was small, however.
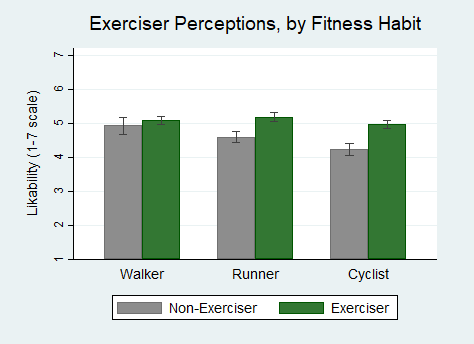
We did find that participants who exercised at least 3-4 times per week liked our hypothetical exerciser significantly more (+0.52 points, p < 0.001). We also found a marginally significant interaction between the main results above for cyclist perceptions and participants’ fitness habitats (p = 0.083). Participants who exercise at least 3-4 times per week liked our cyclist (avg. = 4.97) about the same as our walker (avg. = 5.09), a difference of only 0.12. But those who don’t regularly exercise liked our cyclist far less (avg. = 4.24) than our walker (avg. = 4.93), a difference of 0.69.
Conclusion
The results suggest that there is a hint of frustration about cyclists. It would be interesting to run this study in a setting like the Netherlands, where cycling as a mode of transportation is not only more common, but also more accommodated via designated bike lanes and intersection signals.
If you’re a cyclist and concerned about these perceptions, keep in mind that those perceptions are mainly from those who don’t regularly exercise. Trying to reasonably accommodate automobiles and pedestrians may go a long way toward mitigating those perceptions. And if you’re a pedestrian or driver who doesn’t exercise, maybe try walking (or cycling) a mile in their shoes.
Methods Note
We used Ordinary Least Squares (OLS) regression analysis to test for significant differences in perceptions between our experimental conditions. For significant differences, the difference between the groups' averages would be large and their corresponding “p-values” would be small. If the p-value is less than 0.05, we consider the difference statistically significant, meaning we'd likely find a similar effect if we ran the study again with this population. To test for significant interactions between the main results and participant demographics, we used OLS regression analyses with interaction terms.
Popular Experiments
COVID MasksDoes wearing a COVID mask affect how others think of you?
|
Video GamesAre video games more enjoyable than board games?
Does age or gender matter? |
Zero-Sum PoliticsDo Democrats or Republicans view society as win-lose?
|


