"What gets measured gets managed." ~Peter Drucker
Overview
What is the purpose of business? Is it making money? Making a difference? Some combination? Or something else? Although the theories are debated, in practice businesses reveal their purpose by what they measure. These performance measures then serve as the goalposts for businesses and their workers to know whether their achieving what matters.
For most businesses, these measures are financial. Revenue, profits, and stock price are all familiar metrics to the business savvy. But more recently, everyday people want businesses to measure performance through more than just traditional metrics. Measures like product quality, customer satisfaction, and community impact have been catching headlines, with the idea that encouraging businesses to measure such outcomes may better align the interests of business with everyday people like us.
But what outcomes do people actually want businesses to measure? To find out, we took 18 performance metrics and conducted a survey experiment with 2,000 participants to test whether presenting everyday people with specific business metrics affects their satisfaction.
The Experiment
We had 2,000 people from Amazon Mechanical Turk participate in a survey experiment in which we presented them with 1 of 18 performance metrics that businesses could use to measure the value they create. We randomized which of these metrics they saw, then had each participant rate their satisfaction with the metric on a 1-7 scale (1 = Very Dissatisfied; 7 = Very Satisfied).
Participants read the following instructions before viewing one metric and rating their satisfaction with it:
Welcome. Today, we request your feedback on an important business topic: Measuring Performance. In the business world, performance metrics tell us how well a firm is creating value for the people it serves. There are many different performance metrics a firm can focus on, but usually a firm chooses one to focus on to guide its strategic direction.
To measure how well businesses are creating value for the people they serve, they could use the following performance metric:
[Metric]
How satisfied or dissatisfied would you be if businesses focused on this performance metric? (Using the 1-7 scale)
To measure how well businesses are creating value for the people they serve, they could use the following performance metric:
[Metric]
How satisfied or dissatisfied would you be if businesses focused on this performance metric? (Using the 1-7 scale)
The performance metrics selected for this experiment were chosen based on a number of factors, including metrics commonly used in business (e.g., revenue), metrics advocated to be used more (e.g., community impact), and measures that fit into the following broader categories:
The specific metrics used for the experiment, 18 in total, are as follows:
Results
We uncovered several interesting differences in satisfaction across these metrics. The most interesting differences were across our 5 broad categories, as illustrated in the graph below.
- Financial
- Product
- Community
- Satisfaction
- Multiple metrics
The specific metrics used for the experiment, 18 in total, are as follows:
- $ Revenue (Money Received)
- $ Profit
- $ Stock Price
- $ Donations to the Community
- Number of Community Members Positively Impacted
- Rankings against Peer Firms
- Number of Customers Served
- Number of Products Sold
- Quality of Products
- Number of Innovative New Products
- Satisfaction of Customers
- Satisfaction of Employees
- Satisfaction of Customers and Employees
- (3 metrics) $ Revenue, $ Stock Price, $ Donations to the Community
- (3 metrics) $ Revenue, Satisfaction of Customers and Employees, Number of Community Members Positively Impacted
- (3 metrics) Number of Products Sold, Satisfaction of Customers and Employees, Community Members Positively Impacted
- (5 metrics) $ Revenue, Product Innovation, Quality, Satisfaction of Customers and Employees, $ Donations to Community
- (5 metrics) Number of Products Sold, Innovation, Quality, Satisfaction of Customers and Employees, Community Impact
Results
We uncovered several interesting differences in satisfaction across these metrics. The most interesting differences were across our 5 broad categories, as illustrated in the graph below.
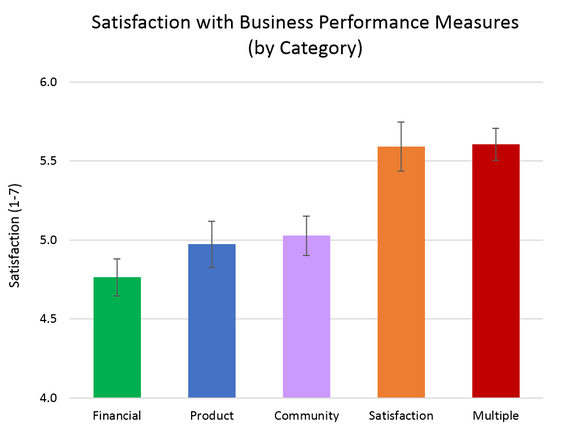
Most notably, financial metrics were rated significantly lower in satisfaction than nonfinancial metrics (diff = -0.59 points on the 1-7 scale; p < 0.001). This may be because financial metrics do a poorer job of measuring value creation than value capture and leave out important non-economic forms of value (Brown, 2019).
Second, people like multiple metrics more than just a single metric (diff = 0.63; p < 0.001). This was true even for the multiple financial metrics condition relative to the single metric financial conditions (diff = 0.45; p = 0.002). It may be that the complexity of creating value in business requires attention to multiple metrics, and funneling them up into a single metric may limit the value businesses can create across multiple stakeholders.
Satisfaction metrics were rated very highly as well, on par with multiple metrics. Satisfaction metrics encompass many more aspects of the business than financial metrics like revenue or profit. For example, customer satisfaction encompasses how well the product actually met the customer's needs even after the sale.
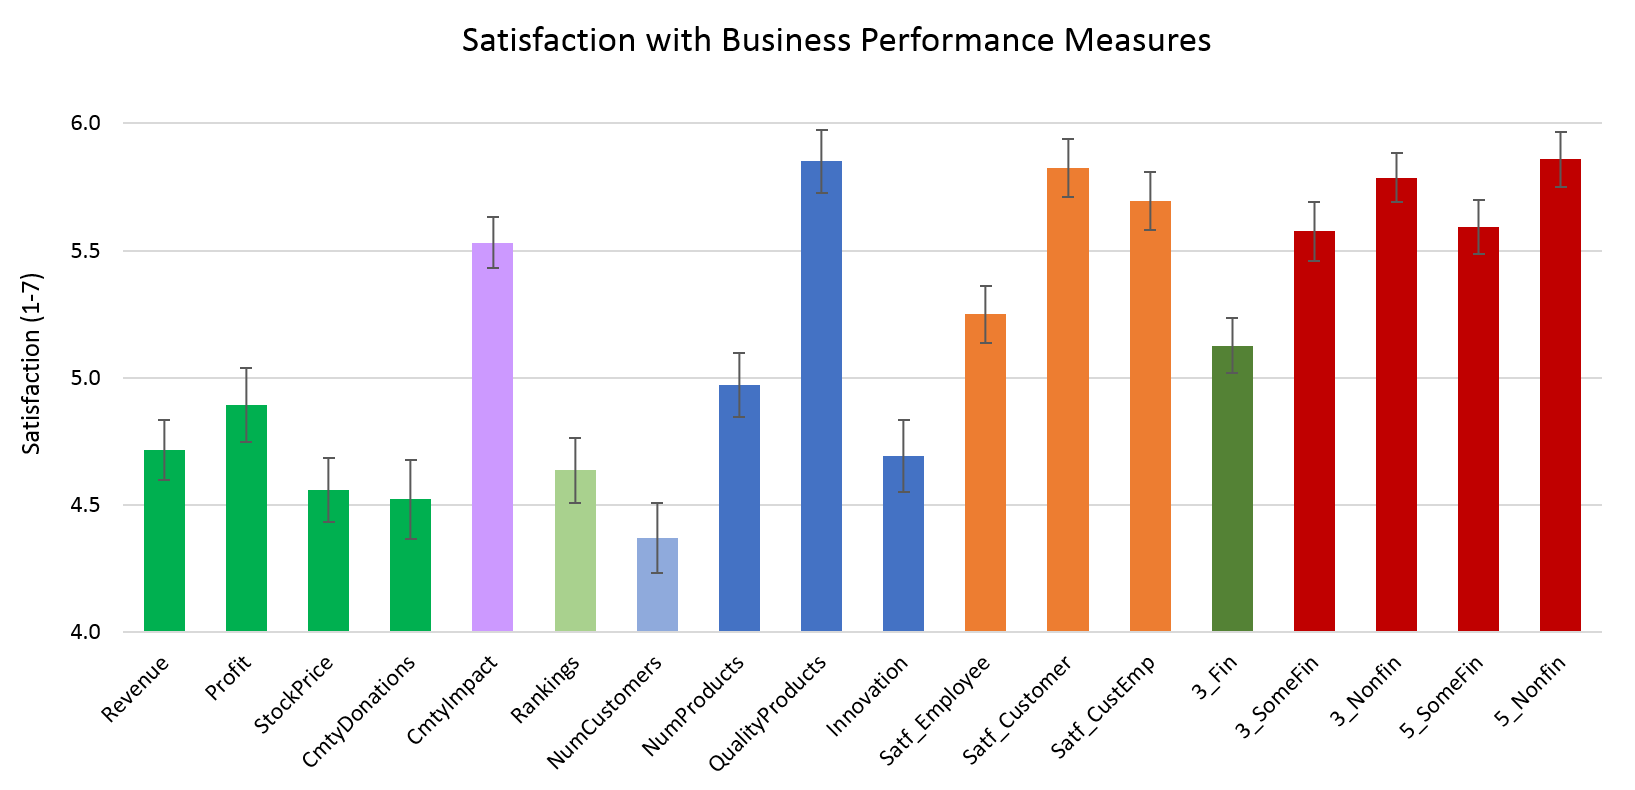
Interesting differences were also found between specific metrics (see graph below), particularly within the product and community categories. Product quality and community positive impact were among the highest rated single metrics, but number of customers served and community donations were among the lowest, by more than a full satisfaction point on the 1-7 scale (a 20% difference; p < 0.001). Each of the financial metrics were rated consistently low, as was product innovation surprisingly.
Conclusion
Not all business metrics are create equal. The significant differences this experiment uncovered suggest that the ways businesses account for value may affect stakeholders' perceptions of the business, and even the potential for value creation itself. Especially when considering that what gets measured gets managed.
Businesses should use less financial metrics, more satisfaction metrics, and multiple metrics when possible. They should also measure product quality and community impact. Although there are many other factors to consider than everyday people's satisfaction with the measures businesses are using, paying more attention to a metric like this, alongside others, may actually help businesses create more value for society.
References
Brown, D. A. (2019). Zero-Sum Games & Zero-Sum Frames: Employee Cognitive Consequences of Financial Firm Performance. Unpublished doctoral dissertation. Harvard Business School, Boston, MA.
Methods Note
We used ordinary least squares (OLS) regression analyses to test for significant differences in satisfaction between the performance metric conditions. For significant differences, the difference between the two groups' averages would be large and its corresponding “p-value” would be small. If the p-value is less than 0.05, we consider the difference statistically significant, meaning we'd likely find a similar effect if we ran the study again with this population.
The survey materials for this experiment are available on our page on the Open Science Framework.

|
Daniel Brown, CPADaniel Brown is an award-winning researcher, social scientist, and founder of AB Labs. He holds a doctorate in Management from Harvard University and has conducted over 100 randomized controlled trials in social psychology. He is a Certified Public Accountant (CPA) in the state of Massachusetts.
|
Popular Experiments

COVID MasksDoes wearing a COVID mask affect how others think of you?
|

Video GamesAre video games more enjoyable than board games?
Does age or gender matter? |

Zero-Sum PoliticsDo Democrats or Republicans view society as win-lose?
|